
If a database is slow and nobody can say why, the AWR report in Oracle is usually the first thing an experienced DBA opens. It shows where the database spent its time between two points: which waits held sessions up, which SQL used the most resources, and which tables and indexes were hit hardest.
The trouble is that a full AWR report runs to dozens of sections, and most people either stop at the first page or get lost in the middle. This guide covers both halves of the job: how to generate the report, and the order in which to read it so you get to the cause quickly.
One thing to check first: licensing. AWR is part of the Oracle Diagnostics Pack, a paid option on Enterprise Edition. Querying most AWR views or running these reports without that licence is a compliance problem, even though the database lets you do it. If you are not licensed, use Statspack, the free predecessor, and set CONTROL_MANAGEMENT_PACK_ACCESS to NONE.
How AWR snapshots work
The Automatic Workload Repository takes a snapshot of performance statistics at a fixed interval, by default every 60 minutes, and keeps them for 8 days in the SYSAUX tablespace. An AWR report is simply the difference between two snapshots. Everything in it is a total or an average over that window, which is why choosing the window matters so much.
Check the current settings, and list the snapshots you have:
SELECT snap_interval, retention FROM dba_hist_wr_control;

SELECT snap_id, begin_interval_time, end_interval_time
FROM   dba_hist_snapshot
ORDER  BY snap_id DESC
FETCH FIRST 24 ROWS ONLY;
On busy production systems many DBAs move to 30-minute snapshots and keep a month or more of history, so they can compare this week with last month. Both values are in minutes:
-- 30-minute snapshots, kept for 30 days (43,200 minutes)
EXEC DBMS_WORKLOAD_REPOSITORY.MODIFY_SNAPSHOT_SETTINGS(interval => 30, retention => 43200);
When you are testing something (a new index, a batch job, a parameter change), take a manual snapshot just before and just after. The report then covers exactly the test and nothing else:
EXEC DBMS_WORKLOAD_REPOSITORY.CREATE_SNAPSHOT;How to generate an AWR report in Oracle
Using awrrpt.sql
The standard way is the awrrpt.sql script that ships with every Oracle home. Connect as a user with DBA privileges and run it from SQL*Plus:
SQL> @?/rdbms/admin/awrrpt.sqlIt asks four things:
- Report type:
htmlortext. Choose HTML. It is far easier to read, and the section links make jumping around quick. - Number of days: how many days of snapshots to list so you can pick from them.
1is enough for most problems. - Begin and end snapshot IDs: pick the pair that covers the problem period, and keep the window tight (one or two snapshot intervals, not a whole day).
- Report name: press Enter for the default, or give it a name you will recognise later, such as the date and the problem.
The two snapshots must come from the same instance startup. If the database was restarted in between, the report fails with an error, because the counters were reset.
In a multitenant database you can run the script in the root container or inside a PDB. Inside a PDB it asks whether to use the root’s data or the PDB’s own snapshots; automatic PDB-level snapshots are off by default. Turn them on by setting AWR_PDB_AUTOFLUSH_ENABLED to TRUE in the PDB and giving it a snapshot interval, or take manual snapshots inside the PDB with CREATE_SNAPSHOT.
For one RAC instance, or the whole cluster
In Oracle RAC, awrrpt.sql reports on the instance you are connected to. Use awrrpti.sql to choose a specific instance (or a different database ID, if you have imported AWR data from another system), and awrgrpt.sql for a global report across all instances:
SQL> @?/rdbms/admin/awrrpti.sql   -- pick the DBID and instance
SQL> @?/rdbms/admin/awrgrpt.sql   -- cluster-wide report
Comparing two periods
The most useful report when someone says “it was fine last week” is the compare-periods report. It puts two windows side by side and shows what changed:
SQL> @?/rdbms/admin/awrddrpt.sqlPick a good period and a bad period of the same length and the same kind of workload (Monday 9 to 10 against Monday 9 to 10, not against a quiet Sunday).
For a single SQL statement
Once you know which SQL_ID is the problem, awrsqrpt.sql produces a report for that one statement, including every execution plan it used in the window:
SQL> @?/rdbms/admin/awrsqrpt.sqlFrom Enterprise Manager
If your team uses Oracle Enterprise Manager Cloud Control, the same reports are under the database’s Performance menu (AWR, then AWR Report). It runs the same code underneath; the scripts are just quicker when you are already in a terminal.
How to read an AWR report: the order that saves time
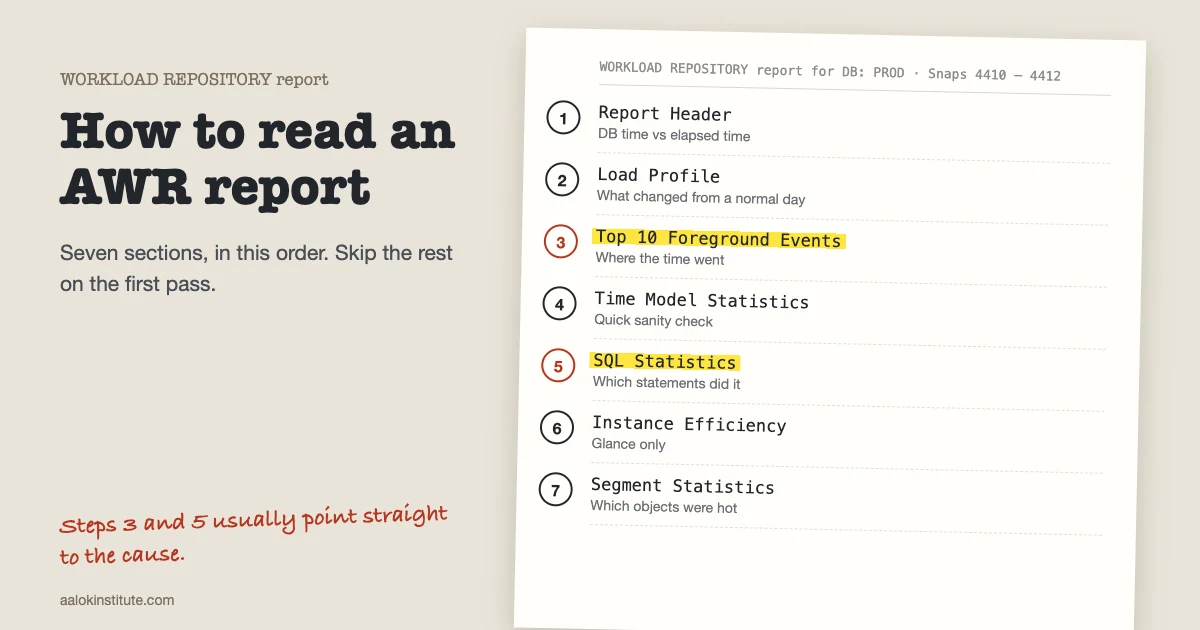
Don’t read it from top to bottom. Go through these seven sections in this order, and most of the time you will know what is wrong by section 5.
1. The header: is the database actually busy?
Compare Elapsed time with DB Time. DB time is the total time sessions spent working or waiting in the database. Divide it by the elapsed time and you get the average active sessions. Sixty minutes elapsed with 240 minutes of DB time means about four sessions were active on average. Compare that with the number of CPUs shown in the header.
If DB time is tiny, the database was not the bottleneck during that window. The slowness is in the application, the network or somewhere else, and the rest of the report will not help much.
2. Load Profile: what kind of work was done?
The Load Profile gives per-second and per-transaction rates: redo size, logical and physical reads, executes, hard parses, transactions. On their own the numbers mean little. Their value is in comparison, so keep a report from a normal day and look for what jumped. A sudden rise in hard parses, for example, usually means an application deployment started sending literals instead of bind variables.
3. Top 10 Foreground Events by Total Wait Time
This is the most important table in the report. It lists what sessions spent their time on, with the percentage of DB time for each. The events you will see most often:
- DB CPU: time on CPU. Usually near the top on a healthy system. It is only a problem if it is close to the CPU capacity in the header, or if the SQL using it is inefficient.
- db file sequential read: single-block reads, usually index access. Check the average wait: as a rough guide, single-digit milliseconds is normal on modern storage, while 15 to 20 ms or more points to a storage problem.
- db file scattered read and direct path read: multiblock reads from full scans. Find out which SQL is scanning, and whether it should be.
- log file sync: sessions waiting for their commit to be written. Too many commits, or slow redo log storage.
- enq: TX – row lock contention: sessions waiting for rows another session has locked. An application design issue far more often than a database one.
- gc cr / gc current events (RAC only): blocks moving between instances. Often reduced by using services to keep related work on one instance; also check interconnect latency and hot blocks.
Look at the % DB time column, not the number of waits. Ten million fast waits can matter less than ten thousand slow ones.
4. Time Model Statistics: where did DB time go?
This section splits DB time into categories such as sql execute elapsed time, parse time elapsed, hard parse elapsed time and PL/SQL execution elapsed time. The categories overlap, so they do not add up to 100%. It is a sanity check: if parse time is a large share, look at parsing; if SQL execution dominates (as it usually does), go to the SQL sections.
5. SQL Statistics: which statements did the damage?
Start with SQL ordered by Elapsed Time, then look at the CPU, Gets and Reads lists depending on what the top events told you. Each row shows the SQL_ID, executions, time per execution and its share of the total. Two patterns to watch for: one statement taking a huge share (a bad plan, or a missing index), or a cheap statement executed millions of times (an application loop).
Take the SQL_ID further with the plan history from AWR:
SELECT * FROM TABLE(DBMS_XPLAN.DISPLAY_WORKLOAD_REPOSITORY('&sql_id'));
-- DISPLAY_AWR still works in 19c but is deprecated
If the statement has more than one plan hash value in the window, the plan changed, and that is very often the whole story.
6. Instance Efficiency: why the hit ratios matter less than they seem
A 99% buffer hit ratio looks reassuring and proves very little: a badly written query that reads the same blocks millions of times will have an excellent hit ratio. Glance at this section for anything unusual, such as a low Soft Parse % (lots of hard parsing), and move on. Never tune to improve a ratio.
7. Segment Statistics: which objects were hot?
Segments by Logical Reads, Physical Reads and Row Lock Waits show which tables and indexes took the load. This usually confirms what the SQL section told you, and it is the quickest way to find the table behind row lock contention.
The rest of the report (I/O statistics by file, the memory advisories, initialisation parameters) is useful for specific questions, but you rarely need it to find the main problem.
Worked example: a nightly batch job that got slow
This is a lab example built on a test system to show the method. The numbers are illustrative, not from a real client.
A batch job that normally takes about 40 minutes ran for two hours. We generated a report for one hour in the middle of the run, between two hourly snapshots.
Header: 60 minutes elapsed, about 240 minutes of DB time, so around four active sessions on an 8-CPU server. The database was clearly busy, so the report is worth reading.
Top foreground events (simplified):
| Event | Total wait (s) | Avg wait | % DB time | Wait class |
|---|---|---|---|---|
| db file sequential read | 8,780 | 6 ms | 61% | User I/O |
| DB CPU | 3,170 | 22% | ||
| log file sync | 575 | 3 ms | 4% | Commit |
| db file scattered read | 430 | 9 ms | 3% | User I/O |
Single-block reads dominate, but at 6 ms each the storage is not slow. The database is simply doing far more index reads than usual, so the question becomes which SQL is responsible.
SQL ordered by Elapsed Time: one UPDATE statement, run with parallel DML at degree 4, accounts for about 70% of DB time, with hundreds of millions of buffer gets. DBMS_XPLAN.DISPLAY_WORKLOAD_REPOSITORY shows two plans for it: last week it used a hash join with a full scan of the staging table; this week it switched to a nested loop driven from the staging table, probing the target table through a non-selective index.
Segment statistics confirm it: the index on the status column sits at the top of Segments by Physical Reads.
Cause: statistics had been gathered on the staging table while it was nearly empty, earlier in the day, so the optimizer thought the table was tiny. Fix: gather statistics after the staging load (or lock good statistics on that table), and pin the good plan with a SQL plan baseline as a safety net. The next run finished in 38 minutes.
That is a typical AWR investigation: header, events, SQL, plan history, segments, cause. Reading AWR reports like this is one of the core skills in Oracle performance tuning, and it is worth practising on a lab database before you need it in production.
AWR vs ADDM vs ASH
| Tool | What it is | Use it when |
|---|---|---|
| AWR | Repository of snapshots (hourly by default), reported with awrrpt.sql | You want the full picture of a period of 30 minutes or more |
| ADDM | Automatic analysis of a pair of AWR snapshots, with findings in plain language (addmrpt.sql) | You want a quick second opinion on what AWR shows |
| ASH | Active Session History: samples every active session once a second (ashrpt.sql, V$ACTIVE_SESSION_HISTORY) | The problem lasted a few minutes and an hourly AWR snapshot would average it away |
All three are part of the Diagnostics Pack. In practice they work together: ASH for a short spike, AWR for the period around it, ADDM to check you have not missed something.
Common mistakes when reading AWR
- A window that is too long. A 24-hour report averages a 20-minute problem into nothing. Keep the window to the problem period, plus a little either side.
- Chasing hit ratios. They describe the workload; they do not tell you what to fix.
- Ignoring DB time. If DB time is low, the database was not the problem, however alarming individual numbers look.
- Comparing unlike periods. Month-end batch against a quiet afternoon will always look like a disaster.
- Fixing the top wait instead of the top SQL. Faster storage would have helped the batch job above a little. Fixing the plan helped it a lot.
AWR questions also come up often in interviews. If you are preparing for one, our list of Oracle DBA interview questions covers the tuning round, and the core Oracle DBA training is where most people first meet AWR. Oracle’s own guide to gathering database statistics goes deeper into how AWR is configured.
Frequently asked questions
Is AWR free in Oracle?
No. AWR is part of the Oracle Diagnostics Pack, a paid option for Enterprise Edition. Using the AWR reports or most DBA_HIST views without that licence is a licence breach (Oracle exempts a handful, such as DBA_HIST_SNAPSHOT), even though the database allows it. Statspack is the free alternative and also works on Standard Edition.
How do I generate an AWR report for the last hour?
Take a manual snapshot with DBMS_WORKLOAD_REPOSITORY.CREATE_SNAPSHOT, then run @?/rdbms/admin/awrrpt.sql. Choose the automatic snapshot taken just over an hour ago as the begin snapshot and your manual snapshot as the end. Automatic snapshots stay on their hourly schedule, so the two most recent ones may cover much less than an hour.
What is the difference between AWR and Statspack?
AWR is built into the database, collects snapshots automatically and includes ASH and ADDM, but it needs the Diagnostics Pack licence. Statspack is free, has to be installed with spcreate.sql and scheduled yourself, and collects less detail. Both produce reports you read in much the same way.
Free demo class
Learn it hands-on, with trainers who work on real production databases
Aalok Institute runs live online and classroom batches in Oracle DBA, PostgreSQL, MySQL, MongoDB, Oracle Cloud and AWS. Tell us what you're preparing for, and we'll suggest the right batch and set up a free demo class.
Prefer a form? Send us an enquiry →- 4.8 ★on Google, from 684 reviews
- 12,000+students trained
- Vashi + onlineClassroom in Navi Mumbai, live online across India